
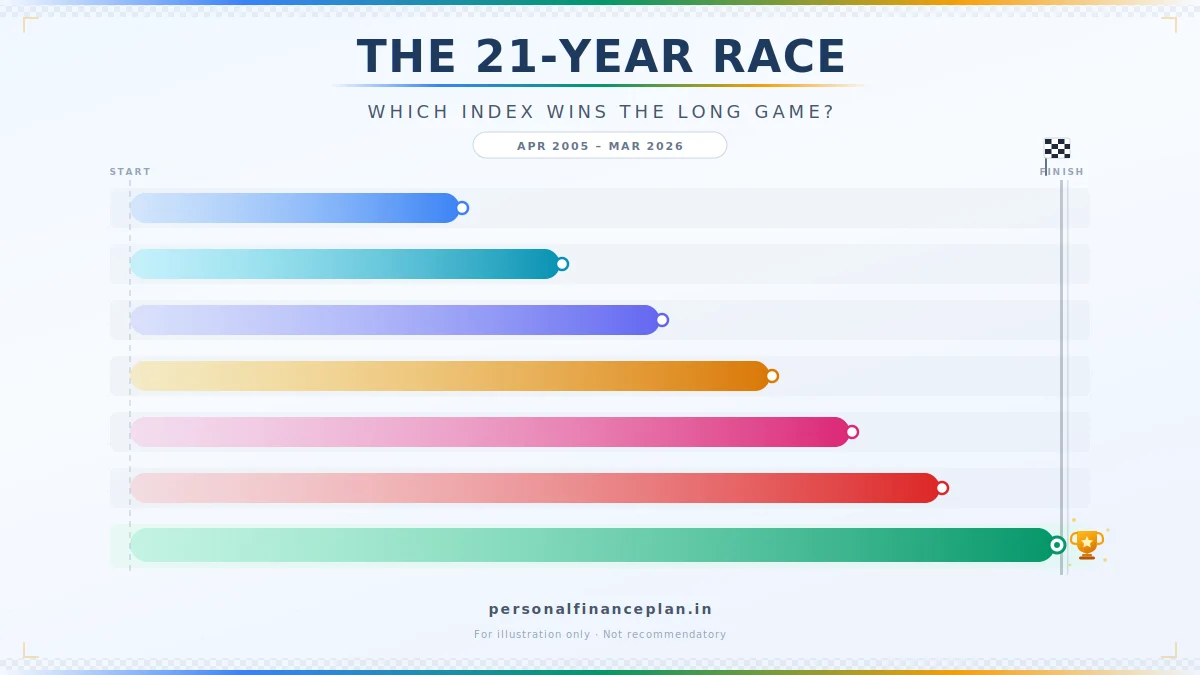
Mumbai, India – The allure of outsized returns often leads investors to seek opportunities in the smaller end of the market capitalization spectrum. In India, this sentiment is particularly pronounced, with many believing that "smaller is better" when it comes to equity investing. While historical data on the surface appears to support this notion, a deeper dive into performance metrics over the past two decades reveals a more nuanced and complex reality. This analysis aims to dissect the performance of various Indian market capitalization-based indices, offering investors a clearer perspective on the trade-offs between size, risk, and return.
The Siren Song of Small and Mid-Caps: A Surface-Level Appeal
For years, anecdotal evidence and select data points have fueled the belief that investing in smaller companies—mid-caps and small-caps—consistently outperforms their larger counterparts. The logic is compelling: smaller companies, often in their growth phases, possess greater potential for exponential expansion, translating into higher returns for investors who identify them early. Indeed, over the last two decades, indices tracking mid and small-cap companies have, at first glance, delivered significantly higher returns than the benchmark Nifty 50.
However, the question remains: is this simplistic correlation the whole story? Does investing in smaller companies always guarantee superior returns? More critically, can the average investor stomach the inherent volatility that often accompanies such investments? This report delves into the performance of eight distinct market capitalization-based indices over a 21-year period, from April 1, 2005, to March 31, 2026, to provide a comprehensive understanding of their behavior.
Defining the Landscape: A Look at the Indices
Before delving into the performance metrics, it’s crucial to understand the composition of the indices under review. This analysis focuses on the Price Index for each, excluding the impact of dividends, and considers a 250-day trading year for consistency. The eight indices examined are:
- Nifty 50: Represents the top 50 largest companies by market capitalization, serving as a benchmark for the Indian large-cap segment.
- Nifty 100: Expands the large-cap universe to the top 100 companies.
- Nifty 500: A broad market index encompassing the top 500 companies, offering a diversified view of the Indian equity market.
- Nifty Large & Midcap 250: A hybrid index comprising the top 100 large-cap companies and the next 150 mid-cap companies.
- Nifty Next 50: Tracks companies ranked 51st to 100th by market capitalization, essentially the next tier of large-cap stocks.
- Nifty Midcap 150: Covers companies ranked from 101st to 250th by market capitalization, representing the mid-cap segment.
- Nifty Smallcap 250: Focuses on companies ranked from 251st to 500th by market capitalization, delving into the small-cap territory.
- Nifty Microcap 250: Extends further down the market capitalization spectrum, tracking companies beyond the Nifty 500.
The fundamental principle guiding this segmentation is that as one moves down the market capitalization ladder, investors are exposed to smaller, often less liquid companies. In theory, this increased risk should be compensated by higher potential returns. This analysis seeks to validate whether this theoretical compensation has materialized in practice.
Calendar Year Returns: The Peaks and Troughs of Performance
A look at average calendar year returns over the 21-year period initially reinforces the "smaller is better" narrative. The Nifty 50 delivered an average annual return of 14.8%. However, the Nifty Midcap 150 significantly outpaced this with an average of 21.2%, and the Nifty Microcap 250 led the pack with an impressive 26.2%. The trend is undeniable: smaller companies, on average, have generated higher returns.

However, this aggregated view masks the stark volatility inherent in these segments. Examining individual years reveals a much more turbulent journey for smaller-cap indices. For instance, during the global financial crisis of 2008, the Nifty 50 saw a decline of 51.8%. In contrast, the Nifty Smallcap 250 plummeted by a staggering 69.1%, and the Nifty Microcap 250 experienced an even more severe fall of 75.2%. This illustrates that while smaller companies can soar higher, they also have a greater propensity to crash harder.
The disparity continued in other years. In 2018, a year of modest gains for the broader market, the Nifty 50 registered a 3.2% increase, while the Nifty Microcap 250 suffered a significant downturn of 27.7%. Similarly, in 2011, a year marked by economic uncertainty, the Nifty 50 fell by 24.6%, but the Nifty Microcap 250 endured a steeper decline of 41.6%. This clearly indicates that the investment ride becomes considerably rougher as one ventures into smaller market capitalization stocks.
Conversely, during bull markets, the smaller indices have showcased their potential for explosive growth. In 2009, a year of strong recovery, the Nifty Next 50 delivered a remarkable 127.9% return, closely followed by the Nifty Microcap 250 at 118.4%. In 2014, the Nifty Microcap 250 surged by 103.3%, and in 2007, the Nifty Smallcap 250 recorded an impressive gain of 94.9%. These figures highlight the exceptional upside potential of smaller companies during favorable market conditions. However, the adage that "what goes up, must come down" holds particularly true in this segment, underscoring the importance of considering downside risk alongside upside potential.
The Crucial Difference: Average Returns vs. CAGR and the Volatility Drag
While average calendar year returns paint an optimistic picture for smaller indices, the real story of wealth creation lies in the Compound Annual Growth Rate (CAGR). The gap between average returns and CAGR is a critical indicator of volatility, often referred to as "volatility drag."
The Nifty Microcap 250, with its average calendar year return of 26.2%, shows a CAGR of only 15.2%. This substantial difference of approximately 11 percentage points highlights the erosive effect of frequent and significant price swings. In stark contrast, the Nifty 50, with an average return of 14.8%, exhibits a CAGR of 12.1%, a much smaller gap of about 2.7 percentage points.
This phenomenon explains why, despite seemingly spectacular average returns, the actual wealth accumulated in smaller indices might not be as dramatic as initially perceived. The compounding effect is significantly hampered by the volatility drag.

From Rs. 100 to Wealth: A Comparative Growth Story
To illustrate the impact of this volatility drag, consider an initial investment of Rs. 100 made in April 2005, growing to March 2026. The results are eye-opening:
- Nifty 50: Rs. 100 would have grown to approximately Rs. 1,086.
- Nifty 100: Rs. 100 would have grown to approximately Rs. 1,164.
- Nifty 500: Rs. 100 would have grown to approximately Rs. 1,342.
- Nifty Large & Midcap 250: Rs. 100 would have grown to approximately Rs. 1,484.
- Nifty Next 50: Rs. 100 would have grown to approximately Rs. 1,044.
- Nifty Midcap 150: Rs. 100 would have grown to approximately Rs. 1,772.
- Nifty Smallcap 250: Rs. 100 would have grown to approximately Rs. 1,728.
- Nifty Microcap 250: Rs. 100 would have grown to approximately Rs. 1,710.
Surprisingly, the Nifty Midcap 150 has actually generated more wealth than the Nifty Microcap 250, despite the latter’s higher average calendar year returns. This outcome is a direct consequence of the volatility drag experienced by the microcap index. The more erratic the price movements, the more the CAGR gets suppressed relative to the average return.
The Uncomfortable Truth: Risk Metrics and Investor Tolerance
Beyond returns, understanding the risk associated with each index is paramount. Standard deviation, a measure of volatility, and maximum drawdown, the peak-to-trough decline, provide crucial insights into the risk profile.
The Nifty 50 exhibits a standard deviation of 20.7% and a maximum drawdown of -59.9%. This means that, on average, its returns fluctuate by about 20.7% annually, and in the worst period, it lost nearly 60% of its value from its peak.
In stark contrast, the Nifty Microcap 250 presents a significantly higher risk profile. Its standard deviation stands at 23%, indicating more pronounced volatility. More alarmingly, its maximum drawdown is -82.3%. This signifies that an investment in this index could have lost over 80% of its value during a severe downturn. To recover from an 82% loss, an investment needs to achieve a staggering 449% rise, a feat that is incredibly challenging and often takes years, if it occurs at all.
Sharpe Ratio: Risk-Adjusted Returns in Perspective
The Sharpe ratio offers a vital measure of risk-adjusted returns, indicating how much excess return an investment has generated per unit of risk taken. A higher Sharpe ratio is generally preferred.
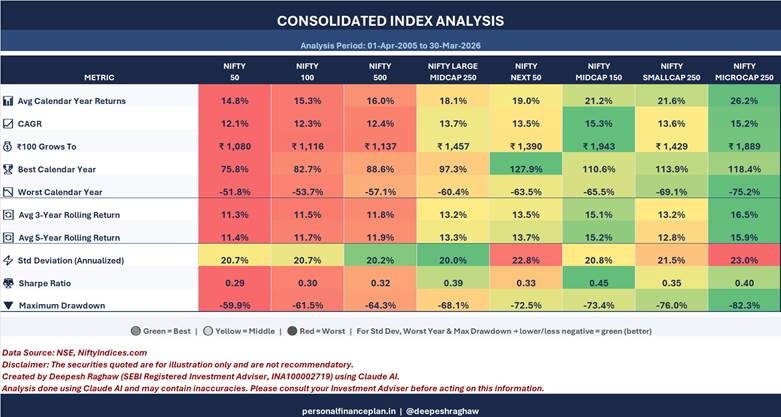
In this analysis, the Nifty Midcap 150 emerges with the highest Sharpe ratio at 0.45, suggesting it has provided the best returns relative to the risk taken. The Nifty 50, while offering lower volatility, has the lowest Sharpe ratio at 0.29. The Nifty Small Cap 250 scores 0.35, while the Nifty Microcap 250 is at 0.40, which is lower than the Nifty Midcap 150. This data suggests that while microcaps might offer higher absolute returns, mid-caps have historically provided a more efficient risk-reward balance over the long term.
Rolling Returns: The Consistency Factor
Rolling returns provide a more realistic assessment of an investment’s performance over various time horizons, smoothing out the impact of single-year anomalies. Analyzing rolling returns helps understand how consistently an index has performed over different periods.
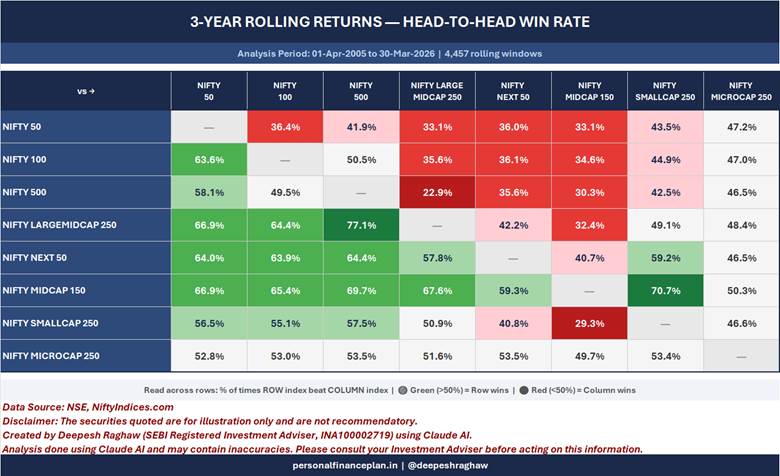
A striking observation from the rolling returns data is that the Nifty Smallcap 250 consistently underperformed the Nifty Midcap 150 in terms of 5-year rolling returns approximately 80% of the time, and in 3-year rolling returns, it lagged about 70% of the time. This is counterintuitive, given that small-cap indices are expected to have higher growth potential due to smaller underlying companies. While the Nifty Smallcap 250 might show outperformance on a point-to-point basis over the entire 21-year period (especially when looking at average calendar year returns), its CAGR and rolling returns often fall behind.
Furthermore, over 5-year rolling returns, the Nifty Smallcap 250 managed to beat the Nifty 50 only about 48.9% of the time. This means that for any random five-year investment period, there was a significant chance that the Nifty 50 would have delivered better returns, despite its lower average annual gains. This underscores the inconsistent nature of returns from smaller-cap segments.
How to Leverage This Information for Investment Decisions
The findings of this analysis have several key implications for investors considering market capitalization-based strategies:
- Understand Your Risk Appetite: The data clearly shows that investing in smaller market capitalization indices comes with significantly higher volatility and drawdown potential. Investors must have a robust risk tolerance and a long-term investment horizon to withstand such fluctuations.
- Don’t Chase Average Returns Blindly: While higher average returns are attractive, they can be misleading due to volatility drag. Focus on CAGR and risk-adjusted returns (Sharpe ratio) for a more accurate picture of wealth creation.
- Mid-Caps as a Sweet Spot: The Nifty Midcap 150 has demonstrated a compelling balance of strong returns and superior risk-adjusted performance, making it a potentially attractive segment for investors seeking growth without the extreme volatility of small and micro-caps.
- Diversification is Key: Relying solely on one market cap segment can be perilous. A diversified portfolio across large, mid, and potentially a small allocation to small-caps, depending on risk tolerance, can help mitigate risks and capture growth opportunities.
- Long-Term Perspective is Crucial: The true benefits of investing in mid and small-caps often materialize over extended periods. Short-term fluctuations should not deter investors with a long-term vision.
- Consider Fund Managers for Smaller Caps: For investors who lack the expertise or time to research individual small-cap stocks, investing through actively managed mutual funds specializing in this segment can be a viable option, as fund managers can navigate the complexities and risks.
Crucial Caveats and Disclaimers
It is imperative to acknowledge the limitations and inherent uncertainties in any investment analysis.
- Past Performance is Not Indicative of Future Results: While historical data provides valuable insights, it does not guarantee future performance. Market conditions, economic factors, and company-specific events can significantly alter investment outcomes.
- Data Limitations: The analysis is based on index performance. Individual stock performance within these indices can vary significantly. Furthermore, the data for the period ending March 31, 2026, is a projection and subject to actual market movements.
- Exclusion of Total Returns: This analysis used Price Indices, excluding the impact of dividends. Including Total Return Indices would present a more complete picture of wealth creation.
- AI Assistance and Potential Inaccuracies: The author utilized Claude AI extensively for this performance analysis. While sample checks were conducted and the findings appear directionally correct, potential inaccuracies may still exist. Investors are strongly advised to conduct their own thorough research or consult with a qualified investment advisor before making any investment decisions.
Source: NiftyIndices.com
Disclaimer: Registration granted by SEBI, membership of BASL, and certification from NISM in no way guarantee performance of the intermediary or provide any assurance of returns to investors. Investment in securities market is subject to market risks. Read all the related documents carefully before investing.
This post is for educational purposes alone and is NOT investment advice. It is not a recommendation to invest or not invest in any product. The securities, instruments, or indices quoted are for illustration only and are not recommendatory. Views may be biased, and aspects important to certain investors may not be focused on. Financial goals and risk profiles vary significantly. Therefore, investors must NOT base their investment decisions solely on this content. There is no one-size-fits-all solution in investments. What may be a good investment for certain investors may NOT be good for others, and vice versa. Hence, it is crucial to read and understand the product terms and conditions and consider your risk profile, requirements, and suitability before investing in any investment product or following an investment approach.