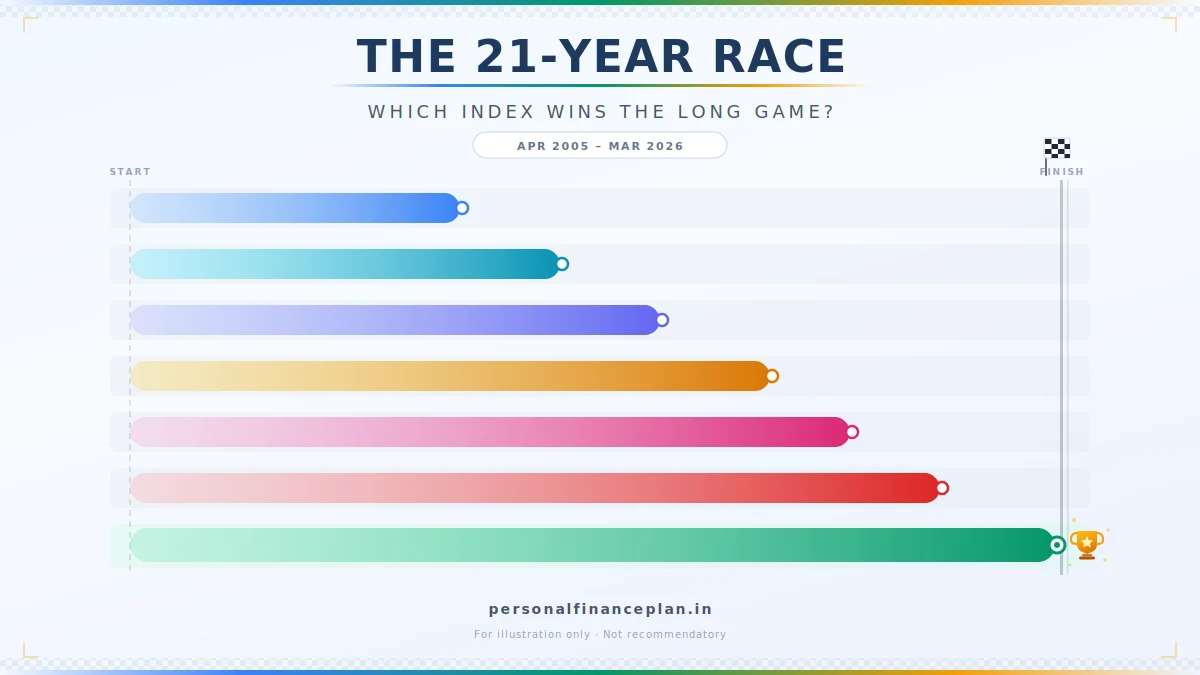
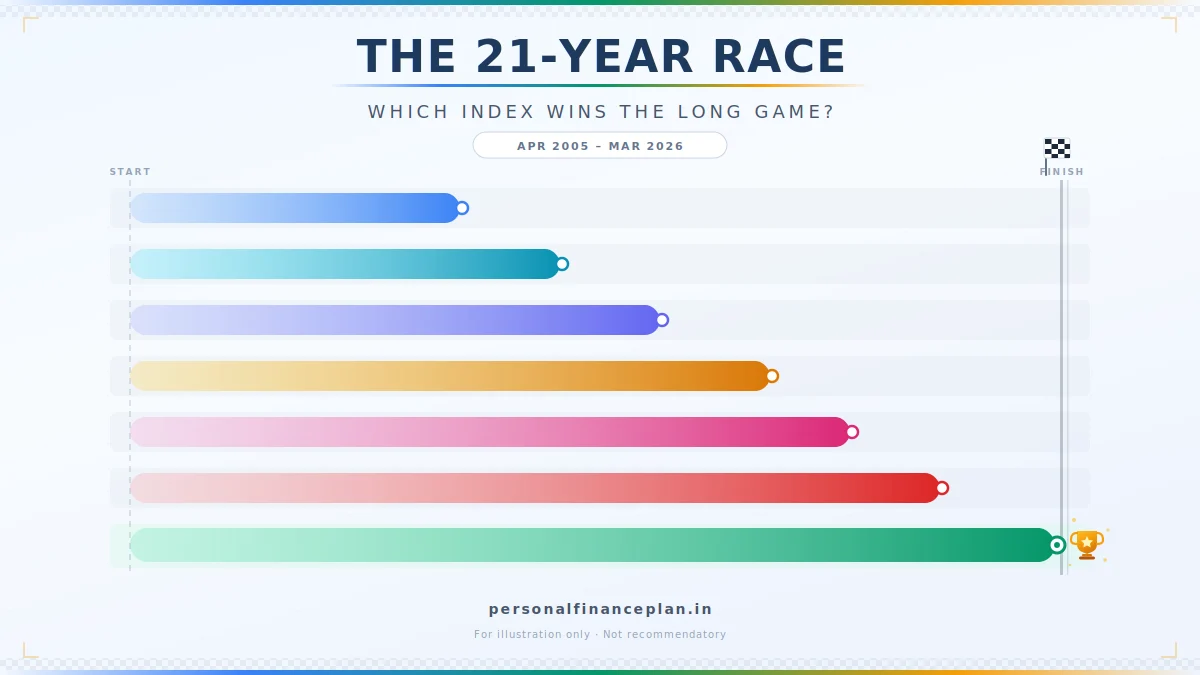
Mumbai, India – April 24, 2024 – A prevailing sentiment in the Indian investment landscape often whispers a simple mantra: "smaller is better." This adage, particularly within equity investing, suggests that venturing into mid and small-cap stocks promises significantly higher returns compared to their large-cap counterparts. While historical data, at first glance, appears to validate this notion, a deeper dive into the nuances of market performance reveals a more complex reality. This analysis scrutinizes 21 years of data across eight cap-based indices to dissect whether smaller indeed always translates to superior returns, and more crucially, whether investors can truly weather the inherent volatility.
The Allure of the Undiscovered: Why Investors Favor Smaller Caps
The basic premise behind investing in smaller capitalization companies is the expectation of higher growth potential. These companies, often in their nascent stages, have more room to expand their operations, innovate, and capture market share. This can translate into exponential returns for early investors. In contrast, large-cap companies, while generally more stable, often operate in mature markets, limiting their upside potential. This fundamental difference in growth trajectory fuels the investor’s fascination with mid and small caps.
However, this increased potential for reward comes hand-in-hand with amplified risk. Smaller companies are typically more susceptible to market downturns, economic shocks, and operational challenges. Their liquidity is often lower, meaning it can be harder to buy or sell shares without significantly impacting the price. This inherent volatility is a critical factor that investors must be prepared to endure.
Unveiling the Data: A 21-Year Performance Deep Dive
To move beyond anecdotal evidence and popular belief, this analysis examines the performance of eight key cap-based indices tracked by the National Stock Exchange (NSE) over a 21-year period, from April 1, 2005, to March 31, 2024. The analysis exclusively utilizes Price Indices, excluding the impact of dividends, to focus solely on the capital appreciation of the underlying stocks. A 250-day trading year has been assumed for consistency in calculations. The performance metrics explored include calendar year returns, Compound Annual Growth Rate (CAGR), rolling returns, and key risk indicators such as standard deviation and maximum drawdown.
The eight indices under consideration represent a broad spectrum of the Indian equity market, categorized by the market capitalization of the companies they track:
- Nifty 50: Represents the top 50 large-cap companies.
- Nifty 100: Expands to the top 100 large-cap companies.
- Nifty 500: A broad market index covering the top 500 companies.
- Nifty Large & Midcap 250: A blend of the top 100 large caps and the next 150 mid-cap companies.
- Nifty Next 50: Tracks companies ranked 51-100 by market capitalization.
- Nifty Midcap 150: Focuses on companies ranked 101-250 by market capitalization.
- Nifty Smallcap 250: Encompasses companies ranked 251-500 by market capitalization.
- Nifty Microcap 250: Delves further down the market cap spectrum, tracking companies ranked 501-750.
Disclaimer: This analysis has been assisted by AI tools. While efforts have been made to ensure accuracy, it is crucial for investors to conduct their own thorough research or consult with a qualified investment advisor before making any financial decisions based on this information.

Understanding the Market Hierarchy: A Quick Refresher
Before delving into the performance figures, it’s essential to grasp the fundamental differences between these indices:
- Nifty 50: The benchmark for large-cap Indian equities, comprising the 50 most liquid and largest companies.
- Nifty 100: A broader representation of large-cap stocks, including the top 100 by market capitalization.
- Nifty 500: A comprehensive index aiming to capture the performance of the Indian equity market by covering the top 500 companies across various sectors.
- Nifty Large & Midcap 250: This index aims to capture the performance of the top 100 companies from the Nifty 50 index and the next 150 companies from the Nifty Midcap 150 index, offering a blend of large and mid-cap exposure.
- Nifty Next 50: Comprises the 50 companies that are not part of the Nifty 50 but are ranked immediately after in terms of market capitalization. These are often considered the "next generation" of large caps.
- Nifty Midcap 150: Focuses on the mid-cap segment, specifically companies ranked 101-250 by market capitalization.
- Nifty Smallcap 250: Targets the small-cap segment, covering companies ranked 251-500.
- Nifty Microcap 250: Represents the smallest capitalization companies within this analysis, covering those ranked 501-750.
As one moves down this market capitalization ladder, the companies generally become smaller, less established, and less liquid. The expectation is that investors are compensated for taking on this additional risk with potentially higher returns. The following data aims to test this hypothesis.
Calendar Year Returns: A Tale of Two Extremes
Examining calendar year returns over the past 21 years paints a vivid picture of the disparity in performance across different market cap segments. On average, the Nifty 50 delivered a respectable 14.8% annual return. However, the mid and small-cap segments significantly outperformed. The Nifty Midcap 150 recorded an average annual return of 21.2%, while the Nifty Microcap 250 surged ahead with an impressive 26.2% average annual return. This initial observation strongly supports the "smaller is better" narrative.
However, the true volatility of these smaller indices becomes starkly apparent when individual years are scrutinized. During the global financial crisis of 2008, the Nifty 50 witnessed a substantial decline of 51.8%. In contrast, the Nifty Smallcap 250 plummeted by a staggering 69.1%, and the Nifty Microcap 250 suffered even more, falling by 75.2%. This dramatic difference underscores the amplified downside risk associated with smaller companies.
Another example of this dichotomy is observed in 2018. While the Nifty 50 registered a modest gain of 3.2%, the Nifty Microcap 250 experienced a significant contraction of 27.7%. Similarly, in 2011, a year of market correction, the Nifty 50 fell by 24.6%, while the Nifty Microcap 250 saw its value erode by a steeper 41.6%. These instances highlight that while smaller companies can deliver exceptional returns in bull markets, they are disproportionately impacted during market downturns.
The upside potential, however, is equally compelling. In strong bull years, smaller indices often lead the charge. For instance, in 2009, a year of recovery, the Nifty Next 50 delivered a phenomenal 127.9% return, closely followed by the Nifty Microcap 250’s 118.4%. In 2014, the Nifty Microcap 250 again demonstrated its high-growth potential with a 103.3% return. The Nifty Smallcap 250 also had its moment in the sun in 2007, with a remarkable 94.9% gain. These figures showcase the significant wealth creation opportunities present in smaller cap segments during favorable market conditions. Nevertheless, the true test of an investment strategy lies not just in its ability to generate stellar returns during good times, but also in its resilience during challenging periods.

Consolidated Performance: The Unvarnished Truth of Wealth Creation
While average calendar year returns offer an enticing glimpse into potential gains, they can be misleading due to the compounding effect of volatility. A more accurate measure of wealth creation is the Compound Annual Growth Rate (CAGR), which accounts for the year-on-year growth of an investment over a specified period.
The discrepancy between average returns and CAGR is particularly pronounced in the smaller cap segments. For the Nifty Microcap 250, the average calendar year return stands at a remarkable 26.2%. However, its CAGR over the 21-year period is a considerably lower 15.2%. This represents a significant "volatility drag" of approximately 11 percentage points. In contrast, the Nifty 50, with an average calendar year return of 14.8%, exhibits a CAGR of 12.1%, indicating a much smaller volatility drag of around 2.7 percentage points. This "volatility drag" phenomenon explains why seemingly spectacular average returns do not always translate into proportionally higher wealth accumulation over the long term. The more volatile an investment’s returns, the greater the erosion of wealth due to the compounding of losses during down periods.
To illustrate this point, consider an initial investment of Rs 100 made in April 2005. By March 2024, this Rs 100 would have grown to different amounts across the indices:
- Nifty 50: Rs 1,145
- Nifty 100: Rs 1,187
- Nifty 500: Rs 1,350
- Nifty Large & Midcap 250: Rs 1,485
- Nifty Next 50: Rs 1,315
- Nifty Midcap 150: Rs 1,660
- Nifty Smallcap 250: Rs 1,540
- Nifty Microcap 250: Rs 1,460
Interestingly, the Nifty Midcap 150 outperformed the Nifty Microcap 250 in terms of absolute wealth creation, despite the latter’s higher average calendar year returns. This outcome directly demonstrates the impact of volatility drag, where the higher swings in the Microcap index, though offering greater highs, also lead to deeper lows that diminish overall compounding.
Risk Assessment: The Uncomfortable Truths of Volatility and Drawdowns
Beyond returns, understanding the risk associated with an investment is paramount. Two key risk metrics provide valuable insights: standard deviation and maximum drawdown. Standard deviation measures the volatility of returns, indicating how much the returns tend to deviate from the average. Maximum drawdown quantifies the largest peak-to-trough decline an investment has experienced over a period.
The Nifty 50 exhibits a standard deviation of 20.7% and a maximum drawdown of -59.9%. While these figures indicate a degree of volatility, they pale in comparison to the smaller cap segments. The Nifty Microcap 250, for instance, shows a standard deviation of 23%, and more alarmingly, a maximum drawdown of -82.3%. This means that an investment of Rs 1,00,000 in the Nifty Microcap 250 could have potentially shrunk to just Rs 17,700 during its worst period. To recover from such a massive loss, the investment would require an astronomical gain of 449%. This stark reality underscores the significant risk of capital erosion in the microcap space.
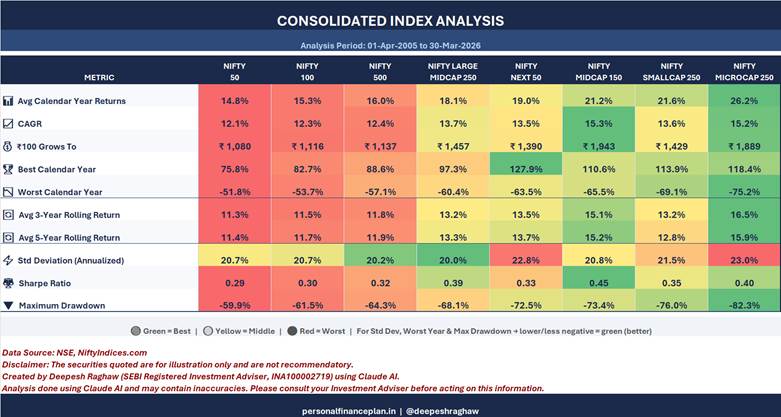
The Sharpe Ratio, which measures risk-adjusted returns (higher is better), offers another perspective. The Nifty Midcap 150 emerges as a strong performer with a Sharpe Ratio of 0.45, indicating efficient returns for the risk taken. The Nifty 50, with a Sharpe Ratio of 0.29, ranks as the lowest among the compared indices. The Nifty Smallcap 250 scores 0.35, while the Nifty Microcap 250 stands at 0.40, which is lower than the Nifty Midcap 150. This suggests that while microcaps might offer higher raw returns, their risk-adjusted performance, as measured by the Sharpe Ratio, is not as superior as the midcap segment.
Rolling Returns: The Quest for Consistency
Rolling returns provide a more dynamic view of an investment’s performance by calculating returns over a fixed period (e.g., 3-year or 5-year) that moves forward incrementally. This metric helps assess the consistency of returns and the probability of an index outperforming another over various timeframes.
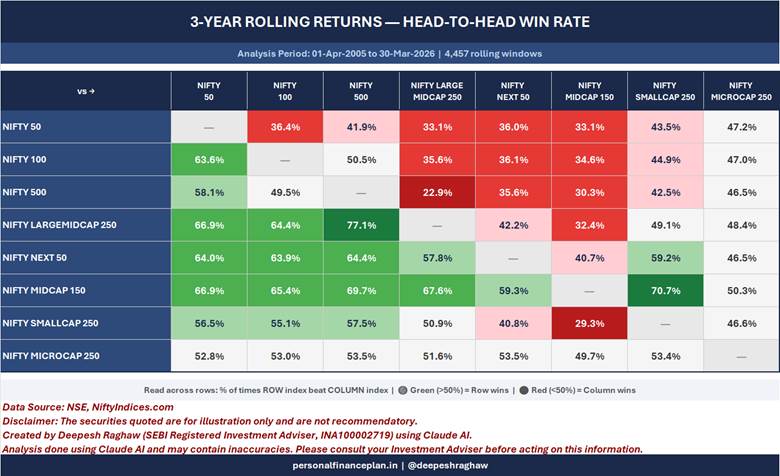
The data on rolling returns reveals some surprising trends. The Nifty Smallcap 250, despite its smaller constituents, lagged behind the Nifty Midcap 150 in terms of 5-year rolling returns over 80% of the time and in 3-year rolling returns for about 70% of the time. This is counterintuitive, as one might expect smaller stocks to consistently outperform over longer periods. While the Nifty Smallcap 250 might show superior point-to-point returns over the entire 21-year horizon, its performance becomes less consistent when viewed through the lens of rolling returns.
Furthermore, over any random 5-year period, the Nifty Smallcap 250 outperformed the Nifty 50 only about 48.9% of the time. This means that for nearly half of all 5-year investment windows, an investor in the Nifty Smallcap 250 would have been better off investing in the Nifty 50, despite the latter’s generally lower average returns. This highlights the inherent unpredictability and inconsistency that often characterizes smaller market segments.
Strategic Implications for Investors: Navigating the Cap Spectrum
The comprehensive analysis of these indices offers several key takeaways for investors seeking to navigate the Indian equity market:
- Embrace Diversification: A diversified portfolio across different market capitalization segments can help balance risk and reward. Relying solely on one segment might expose investors to excessive risk or missed opportunities.
- Understand Your Risk Tolerance: The significantly higher volatility and deeper drawdowns in smaller cap indices necessitate a robust risk tolerance. Investors with a low risk appetite might find the ride too turbulent.
- Focus on CAGR and Risk-Adjusted Returns: While headline average returns can be attractive, CAGR and risk-adjusted metrics like the Sharpe Ratio provide a more realistic picture of wealth creation and the efficiency of returns.
- Consider Midcaps for a Balanced Approach: The Nifty Midcap 150 demonstrates a compelling combination of higher returns than large caps, coupled with superior risk-adjusted performance compared to the Nifty Microcap 250, making it a potentially attractive segment for many investors.
- Small and Microcaps Require Diligence: Investments in Nifty Smallcap 250 and Nifty Microcap 250 demand thorough research, a long-term investment horizon, and the capacity to withstand significant volatility. The potential for higher returns is present, but so is the risk of substantial capital loss.
- Rebalancing is Crucial: As smaller companies grow and move up the market cap ladder, their risk profile changes. Periodically rebalancing a portfolio to adjust for these shifts can help maintain the desired asset allocation and risk level.
The Caveats: Acknowledging the Limitations
It is imperative to acknowledge certain limitations inherent in this analysis:
- Price Index vs. Total Return Index: This analysis uses Price Indices, which do not account for dividend reinvestment. Total Return Indices, which include dividends, would likely show higher absolute returns, particularly for dividend-paying stocks.
- AI-Assisted Analysis: While AI tools were used to assist in the data processing and analysis, there’s always a possibility of subtle inaccuracies. Independent verification and due diligence are strongly recommended.
- Market Conditions are Dynamic: Past performance is not indicative of future results. Market conditions, economic cycles, and regulatory changes can significantly impact the future performance of these indices.
- Individual Stock Performance: Index performance represents the aggregate behavior of a basket of stocks. Individual stock performance within any segment can vary widely, with some stocks significantly outperforming or underperforming the index.
Conclusion: Beyond the Simple Mantra
The data unequivocally demonstrates that while smaller capitalization stocks in India have historically offered higher average returns, this comes at the cost of significantly amplified volatility and deeper drawdowns. The allure of exponential growth in mid and small caps is undeniable, but investors must temper this excitement with a clear understanding of the inherent risks. The concept of "volatility drag" significantly impacts long-term wealth creation, as evidenced by the widening gap between average returns and CAGR in smaller segments.
The Nifty Midcap 150 emerges as a potentially attractive sweet spot, offering a more balanced risk-reward profile. For investors with a higher risk appetite and a long-term perspective, small and microcaps can be rewarding, but they demand meticulous research, patience, and the emotional fortitude to navigate market downturns. Ultimately, the decision of where to invest within the Indian equity market should be guided by individual financial goals, risk tolerance, and a comprehensive understanding of the trade-offs involved, rather than a simplistic belief that "smaller is always better."
Source: NiftyIndices.com
Disclaimer: Registration granted by SEBI, membership of BASL, and certification from NISM in no way guarantee performance of the intermediary or provide any assurance of returns to investors. Investment in securities market is subject to market risks. Read all the related documents carefully before investing. This post is for educational purposes only and is NOT investment advice. This is not a recommendation to invest or NOT invest in any product. The securities, instruments, or indices quoted are for illustration only and are not recommendatory. Views may be biased, and certain aspects may not be focused on. Financial goals and risk profiles vary. Therefore, you must NOT base your investment decisions solely on this content. There is no one-size-fits-all solution in investments. Always read and understand the product terms and conditions and consider your risk profile, requirements, and suitability before investing in any investment product or following an investment approach.