
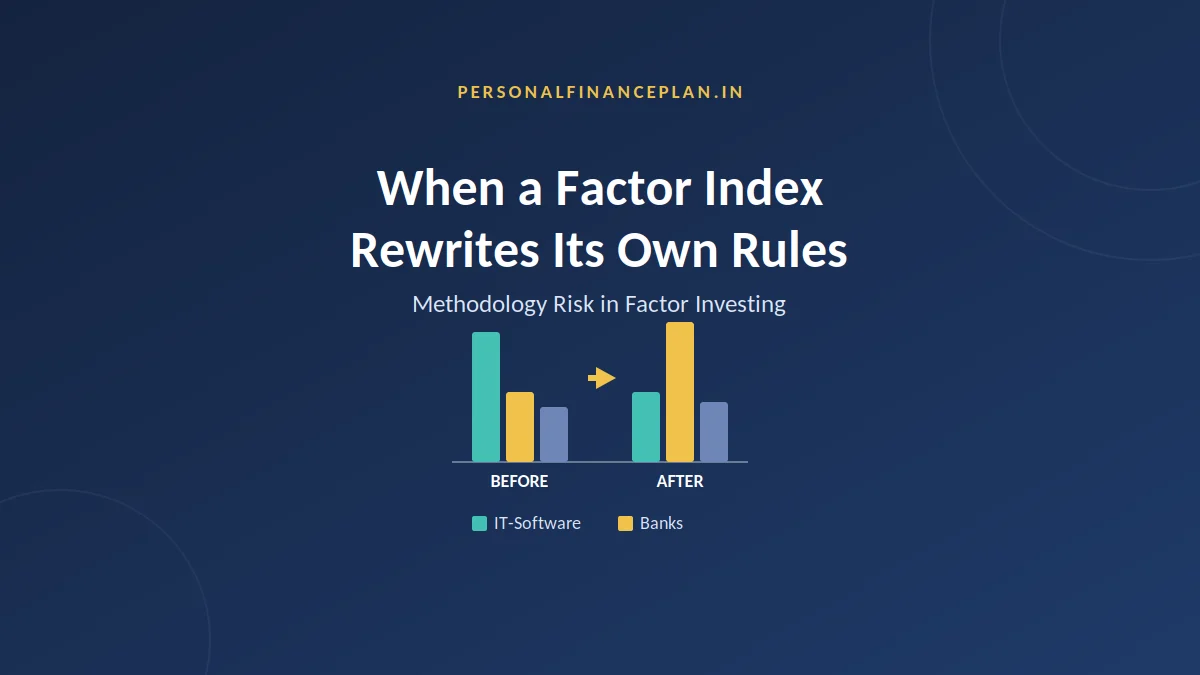
New Delhi, India – Investors who meticulously chose a value index fund, driven by the allure of acquiring undervalued companies for long-term growth, are facing an unexpected shift. The very definition of "value" that underpinned their investment strategy has been revised by the index provider, leading to a significant alteration in their portfolio’s composition, even without any fault on the part of the fund manager or the investor. This subtle yet impactful change highlights a critical, often overlooked risk inherent in factor-based index investing: the potential for the underlying rulebook itself to be rewritten.
This article delves into the implications of such methodology changes, using the Nifty 50 Value 20 (NV20) index as a case study. We will explore the mechanics of factor indices, analyze the specific alterations made to the NV20 index, and contrast this with the relative stability of market-capitalization-based indices, ultimately offering insights for investors navigating this complex landscape.
The Evolving Blueprint: Understanding Factor Indices
At its core, a market-capitalization index, such as the Nifty 50, provides a straightforward answer to a singular question: "How large is this company?" It comprises the 50 largest publicly traded companies, weighted according to their free-float market capitalization. This established framework offers a degree of predictability and stability.
Factor indices, however, operate on a fundamentally different principle. They are not merely a snapshot of market size but rather a carefully crafted "recipe" – a set of specific rules designed to capture a particular investment factor. These factors can include value, momentum, quality, low volatility, alpha, or equal weighting. Each factor index dictates which stocks qualify for inclusion and how their weight within the portfolio is determined.
The critical distinction lies in ownership and control. The index provider, the entity that designs and maintains these factor indices, retains the prerogative to revise this "recipe." While these revisions are often implemented with ostensibly sound reasoning – aiming to better capture the intended factor – they can lead to substantial shifts in the underlying holdings of funds tracking these indices. For investors, this means their portfolio can evolve significantly without any proactive decision on their part, solely as a consequence of the index provider’s updated methodology.
A Closer Look at the Nifty 50 Value 20: A Case of Shifting Definitions
The Nifty 50 Value 20 index, designed to provide exposure to undervalued stocks within the Nifty 50 universe, recently underwent a significant overhaul of its methodology. This change, while published in the index provider’s documentation, may not have reached the wider investor base in a readily digestible format.
Table 1: Evolution of the Nifty 50 Value 20 Index Methodology
| Dimension | Old Methodology (Approx. Sep 2024) | New Methodology (Approx. Jul 2026) |
|---|---|---|
| Value Factors Used | ROCE, PE, PB, Dividend Yield | Earnings/Price (E/P), Book/Price (B/P), Sales/Price (S/P), Dividend Yield |
| Factor Weighting | Rank-weighted: 40% ROCE, 30% PE, 20% PB, 10% DY | Equal weighting: 0.25 each on E/P, B/P, S/P, DY |
| Selection Method | Ordinal rank on each factor; ranks blended; top 20 by final rank | Z-score of each factor; weighted-average Z; top 20 by value score |
| Constituent Weighting | Free-float market capitalization | Free-float market cap x value score |
| Reconstitution Frequency | Annual, December only | Semi-annual, June and December |
| Data Window for Review | Reviewed in December (annual) | Six months ending May and November |
| Capping Realignment | 15% cap, realigned quarterly (Mar/Jun/Sep/Dec) | 15% cap, realigned semi-annually at rebalancing |
Data Source: NiftyIndices.com (Methodology Document)
Previously, the NV20 index selected stocks based on Return on Capital Employed (ROCE), Price-to-Earnings (PE), Price-to-Book (PB), and Dividend Yield. A substantial 40% weight was allocated to ROCE, and the index was reconstituted annually in December.
The revised methodology marks a departure from this approach. ROCE has been entirely removed, and the stock selection now relies on Earnings-to-Price (E/P), Book-to-Price (B/P), Sales-to-Price (S/P), and Dividend Yield, with each factor receiving an equal weight. Furthermore, the rebalancing frequency has increased to semi-annual, occurring in June and December.
This methodological shift has tangible consequences. A comparison of portfolio compositions before and after a recent rebalancing period (May 2026 vs. June 2026) reveals significant sector rotations.
Table 2: Sectoral Allocation Shifts in Nifty 50 Value 20 Index
| Industry | May 2026 (%) | June 2026 (%) | Change (June – May) (%) |
|---|---|---|---|
| Banks | 40.60 | 46.26 | +5.66 |
| IT – Software | 22.42 | 12.25 | -10.17 |
| Petroleum Products | – | 12.47 | +12.47 |
| Automobiles | 9.08 | 3.49 | -5.59 |
| Power | 7.71 | 5.15 | -2.56 |
| Diversified FMCG | 6.77 | 5.58 | -1.19 |
| Non-Ferrous Metals | 3.99 | 2.29 | -1.70 |
| Oil | 2.52 | 3.90 | +1.38 |
| Pharmaceuticals & Biotech | 3.88 | – | -3.88 |
| Consumable Fuels | 2.55 | 3.04 | +0.49 |
| Cement & Cement Products | – | 1.99 | +1.99 |
| Ferrous Metals | – | 1.98 | +1.98 |
| Finance | – | 1.35 | +1.35 |
| Total Equity | 99.52 | 99.75 | +0.23 |
Source: Monthly Portfolio Disclosures, Nippon AMC
The most striking changes include a significant increase in the weight of Banks and the addition of Petroleum Products, while Information Technology (IT) stocks experienced a substantial reduction in their allocation. This illustrates how a change in the underlying rules can dramatically reshape the investment landscape for a fund.
Unpacking the Rationale: Why the Change?
The precise impetus behind the NV20 index methodology revision remains undisclosed by the index provider. However, a compelling explanation centers on the definition of "value" itself. The inclusion of ROCE, a metric more aligned with "quality" and "profitability," in the previous methodology might have diluted the pure "value" signal.
ROCE measures how efficiently a company generates profits from its capital. Asset-light, high-margin businesses, such as IT services and FMCG firms, often exhibit high ROCE. However, this metric can be problematic for capital-intensive sectors like banking, where the formula can yield distorted results due to large deposits and borrowings. Furthermore, companies with higher ROCE often command premium valuations, potentially contradicting the objective of seeking undervalued assets.
The revised methodology, focusing exclusively on Price-to-Earnings, Price-to-Book, Price-to-Sales, and Dividend Yield, aligns more closely with traditional definitions of value investing. These metrics directly assess a company’s valuation relative to its earnings, book value, sales, and dividend payouts.
Speculation also suggests that the recent underperformance of the NV20 index, possibly exacerbated by its previous heavy allocation to IT stocks amidst concerns about Artificial Intelligence’s impact, might have influenced the revision. A desire to reduce exposure to sectors perceived as facing headwinds could have been a contributing factor.
The Information Gap: When Does the Investor Know?
A significant concern arising from such methodology changes is the lack of proactive communication to the end investor. The stock exchange (NSE in this case) is unlikely to directly inform every investor holding an ETF or mutual fund tracking a specific index. Fund houses (AMCs), possessing both investor contact details and awareness of index methodology shifts, are better positioned to bridge this gap. However, the expectation of proactive communication from AMCs regarding such fundamental changes remains an area for potential improvement.
The author’s own discovery of this methodology change was serendipitous, triggered by observing the NV20 index’s lack of expected gains despite a surge in IT stocks. A deeper investigation revealed the drastic reduction in IT stock allocation due to the revised methodology. The absence of clear historical context within the updated methodology documents further complicates understanding the evolution of these indices.
This situation draws a parallel to the "fund manager risk" in actively managed funds, where investors rely on the manager’s judgment. However, factor funds are typically chosen for their rule-based, systematic approach, promising to mitigate such discretionary risks. When the very rules governing these systematic strategies can be altered, this perceived comfort is eroded.
The Unshakeable Foundation: Market-Cap Indices and Future Considerations
In contrast to the dynamic nature of factor indices, market-capitalization indices offer a more stable framework. Their methodology for defining "large-cap," "mid-cap," or "small-cap" is objective and rarely subject to redefinition. While constituents may be added or removed based on market performance, the fundamental definition of size remains consistent. This inherent stability makes market-cap indices a preferred choice for the core of an equity portfolio, providing a reliable foundation.
Factor index funds and ETFs can still play a role, but perhaps as a "satellite" component of an equity portfolio, akin to actively managed funds. The decision to invest in factor funds, the specific products chosen, and the allocation size must be carefully considered based on an individual’s risk profile and conviction in the chosen factor strategy.
Key Takeaways for Investors:
- Understand the Rules: Factor indices are defined by rulebooks that can change. Investors must diligently check the methodology documents of the indices their funds track.
- Past Performance is Not a Guarantee: A methodology change can render historical performance data less relevant, as the underlying strategy that produced that performance may no longer be in place.
- Proactive AMCs are Valued: Investors should look for fund houses that demonstrate transparency and proactively communicate significant index methodology changes.
- Diversify Your Core: For the core of your equity portfolio, consider the stability and predictability of market-capitalization indices.
- Strategic Allocation to Factors: If investing in factor funds, do so strategically, understanding the risks associated with potential methodology shifts and sizing your allocation accordingly. A strategy whose definition can change should not form the largest portion of your holdings.
- Regular Review is Crucial: Investors should periodically revisit their decisions to invest in factor index products, especially if there are drastic changes in their underlying methodology.
The evolving landscape of index methodologies underscores the importance of informed investing. While factor investing offers compelling potential, investors must remain vigilant, understanding that the blueprints for their investments are not always set in stone. A thorough understanding of index construction and a commitment to ongoing due diligence are paramount to navigating the complexities of modern investment strategies.
Disclaimer: This article is for educational purposes only and does not constitute investment advice. The securities, instruments, or indices mentioned are for illustrative purposes and are not recommendations. Investors should conduct their own research, understand the product terms and conditions, and consult with a qualified financial advisor before making any investment decisions. Registration with SEBI, membership of BASL, and NISM certification do not guarantee investment performance or returns. Investment in the securities market is subject to market risks.