Introduction
Investors often seek the perceived simplicity and transparency of index funds, particularly those tracking specific investment factors like "value." The allure of buying stocks deemed undervalued, based on a clear set of metrics, coupled with a long-term investment horizon, can be a powerful draw. However, a critical and often overlooked risk lurks within this seemingly straightforward approach: the potential for the very definition of the factor itself to be altered by the index provider. This phenomenon, while not indicative of any wrongdoing, can fundamentally change the composition of a portfolio that faithfully tracks its designated index, leaving investors with holdings quite different from what they initially intended.
This article delves into this often-unconsidered risk, examining how changes to index methodologies can impact investors. We will use the specific case of the Nifty 50 Value 20 index as a detailed example to illustrate the intricacies of these shifts. Furthermore, we will explore why traditional market capitalization-weighted indices are largely insulated from this particular form of risk.
The "Rulebook" of Factor Indices: More Than Meets the Eye
At its core, a market capitalization index, such as the Nifty 50, operates on a relatively simple principle: identify the largest companies by free-float market capitalization. The rulebook is concise: the 50 largest stocks, weighted by their market value. This straightforward definition offers a high degree of predictability and stability.
Factor indices, however, operate on a fundamentally different paradigm. They are not merely lists of companies; they are, in essence, intricate "recipes." These recipes, built around factors like value, momentum, quality, low volatility, or alpha, are sets of rules designed to identify specific characteristics of companies and assign them appropriate weights within the index. The "value" factor, for instance, typically aims to identify stocks trading below their intrinsic worth, often based on metrics like low price-to-earnings (P/E) ratios, low price-to-book (P/B) ratios, or high dividend yields.
The crucial distinction here lies in ownership and control. The index provider, the entity that designs and maintains these factor recipes, retains the authority to revise them. While these revisions are often undertaken with the purported aim of better capturing the intended investment factor, they can lead to significant shifts in the index’s composition. These changes are typically disclosed in the provider’s methodology documents and factsheets. For investors holding index funds or Exchange Traded Funds (ETFs) that faithfully track these indices, any alteration to the underlying methodology automatically translates into a change in their portfolio’s holdings, without any direct action from the fund manager or the investor.
Case Study: The Metamorphosis of the Nifty 50 Value 20 Index
To understand the practical implications of index methodology changes, we will examine the recent evolution of the Nifty 50 Value 20 index. This index, designed to provide exposure to value-oriented stocks within the Nifty 50 universe, has undergone a significant revision in its selection criteria and rebalancing frequency.
H2: Unpacking the Methodology Shift
Historically, the Nifty 50 Value 20 index employed a methodology that included Return on Capital Employed (ROCE), Price-to-Earnings (P/E), Price-to-Book (P/B), and Dividend Yield as its primary value factors. Notably, ROCE held the largest weight at 40%, suggesting a blend of value and quality considerations. The index was reconstituted annually, with changes implemented in December.
However, a recent overhaul has dramatically reshaped this index’s definition of "value" and its operational mechanics. The revised methodology, as outlined in the updated documentation, has seen the removal of ROCE from the selection criteria. The focus has now shifted to a more conventional set of value metrics: Earnings-to-Price (E/P), Book-to-Price (B/P), Sales-to-Price (S/P), and Dividend Yield. Crucially, these four factors are now weighted equally at 0.25 each, creating a more uniform emphasis on each metric.
The selection method itself has also been refined. The old system relied on ordinal ranking for each factor, with ranks blended to determine the top 20 constituents. The new approach utilizes Z-scores for each factor, followed by a weighted average Z-score to arrive at the final "value score" for selecting the top 20 companies.
Furthermore, the constituent weighting has been altered. While free-float market capitalization remains a component, it is now multiplied by the stock’s value score, introducing a dynamic element to how individual stock weights are determined. The rebalancing frequency has also been increased from annual to semi-annual, occurring in June and December, with the data window for review now encompassing the six months ending in May and November.
Table 1: Evolution of Nifty 50 Value 20 Index Methodology
| Dimension | Old Methodology (Sep 2024) | New Methodology (Jul 2026) |
|---|---|---|
| Value Factors Used | ROCE, PE, PB, Dividend Yield | Earnings/Price (E/P), Book/Price (B/P), Sales/Price (S/P), Dividend Yield |
| Factor Weighting | Rank-weighted 40% ROCE, 30% PE, 20% PB, 10% DY | Equal 0.25 each on E/P, B/P, S/P, DY |
| Selection Method | Ordinal rank on each factor; ranks blended; top 20 by final rank | Z-score of each factor; weighted-average Z; top 20 by value score |
| Constituent Weighting | Free-float market capitalization | Free-float market cap x value score |
| Reconstitution Frequency | Annual, December only | Semi-annual, June and December |
| Data Window for Review | Reviewed in December (annual) | Six months ending May and November |
| Capping Realignment | 15% cap, realigned quarterly | 15% cap, realigned semi-annually at rebalancing |
Data Source: NiftyIndices.com (Methodology document)
H3: The Impact on Portfolio Composition: A Sectoral Shift
The consequences of these methodology changes are evident in the shifts observed in the index’s sectoral composition. Data from Nippon AMC’s monthly portfolio disclosures reveals a notable change between May 2026 and June 2026, coinciding with the likely first rebalance under the new methodology.
Table 2: Sectoral Weightage Changes in Nifty 50 Value 20 Index (June vs. May 2026)
| Industry | May 2026 | June 2026 | Change (June – May) |
|---|---|---|---|
| Banks | 40.60% | 46.26% | +5.66% |
| IT – Software | 22.42% | 12.25% | -10.17% |
| Petroleum Products | – | 12.47% | +12.47% |
| Automobiles | 9.08% | 3.49% | -5.59% |
| Power | 7.71% | 5.15% | -2.56% |
| Diversified FMCG | 6.77% | 5.58% | -1.19% |
| Non-Ferrous Metals | 3.99% | 2.29% | -1.70% |
| Oil | 2.52% | 3.90% | +1.38% |
| Pharmaceuticals & Biotech | 3.88% | – | -3.88% |
| Consumable Fuels | 2.55% | 3.04% | +0.49% |
| Cement & Cement Products | – | 1.99% | +1.99% |
| Ferrous Metals | – | 1.98% | +1.98% |
| Finance | – | 1.35% | +1.35% |
| Total equity | 99.52% | 99.75% | +0.23% |
Source: Monthly Portfolio Disclosures, Nippon AMC
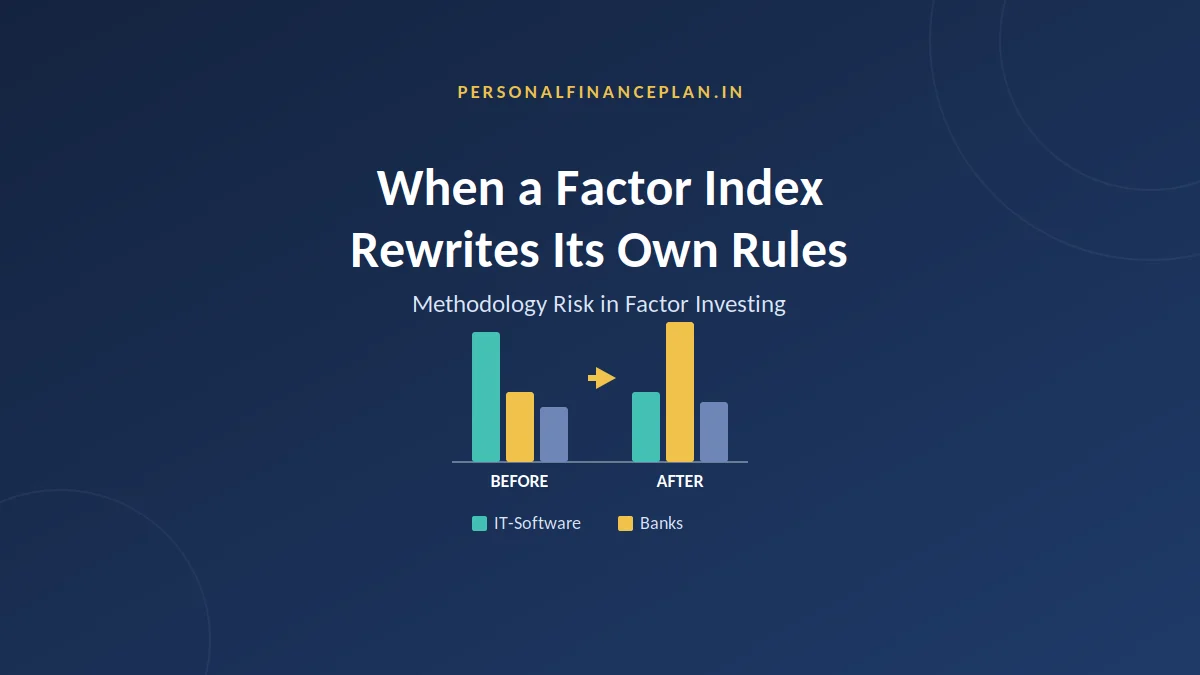
The data clearly illustrates a significant reallocation. The weightage in IT – Software stocks has been drastically reduced by over 10%, while the allocation to Banks has seen a substantial increase of over 5%. New sectors like Petroleum Products and Finance have entered the index, while Pharmaceuticals and Biotechnology has seen its allocation removed entirely. This dramatic shift in sector exposure, occurring without any change in the index’s name, underscores the profound impact of methodology revisions.
H2: Potential Drivers Behind the Methodology Overhaul
While the index provider has not publicly detailed the specific rationale for these changes, several compelling explanations can be inferred. The most probable driver is a desire to align the index more closely with a conventional definition of "value."
H3: ROCE: A Quality Metric Misaligned with Pure Value?
The inclusion of ROCE, a measure of profitability relative to capital employed, has been a point of contention. ROCE is fundamentally a quality metric, indicating how efficiently a company utilizes its capital. By assigning it a substantial weight (40%) in the previous methodology, the Nifty 50 Value 20 index was, in effect, providing exposure to "Quality-Value" stocks.
However, ROCE can be counterintuitive to a pure value strategy. Asset-light businesses with high margins, such as IT services and fast-moving consumer goods (FMCG), tend to exhibit higher ROCE ratios. Conversely, sectors like banking, where deposits and borrowings are intrinsic to operations, often have significantly higher capital employed, leading to distorted ROCE figures. Moreover, companies with higher ROCE often command premium valuations in the market, which is antithetical to the core principle of value investing – buying undervalued assets. Therefore, a significant weighting to ROCE could have been diluting the intended "value" signal of the index.
The revised methodology, by focusing solely on price-based ratios like E/P, B/P, and S/P, along with dividend yield, represents a return to more traditional and widely accepted measures of value.
H3: Speculation on Performance and Sectoral Concerns
Another potential, albeit speculative, reason for the change could be the index’s recent performance and prevailing market sentiment towards certain sectors. There is a possibility that the index’s previous heavy weighting in IT stocks, a sector that has faced headwinds due to advancements in Artificial Intelligence, may have led to underperformance. The index provider might have sought to reduce this exposure by revising the methodology. However, it is important to emphasize that this remains speculation.
H2: The Unseen Risk: How Investors Become Aware of Changes
One of the most significant challenges for investors is the lack of direct communication regarding such methodology changes. Index providers like NSE do not typically have direct contact with individual investors holding funds that track their indices. Therefore, the onus of disseminating this information often falls upon the Asset Management Companies (AMCs) that manage the index funds and ETFs.
H3: The AMC’s Role and Proactive Disclosure
AMCs are in possession of both the knowledge of the index methodology change and the contact details of their investors. A truly proactive AMC, recognizing the potential impact on its clients, should ideally flag such significant methodological shifts. This would allow investors to make informed decisions about their holdings.
The author’s own discovery of the Nifty 50 Value 20 index methodology change was serendipitous. Noticing the index’s sluggish performance despite a rally in IT stocks prompted a deeper investigation, which revealed the substantial reduction in IT sector allocation and, subsequently, the revised methodology document. The absence of explicit details on the timing and reasons for the methodology change within the new documentation further highlights the opacity surrounding such events.
H3: Erosion of Past Performance as a Reliable Indicator
A critical consequence of methodology changes is the undermining of past performance as a reliable indicator of future results. When the underlying rules of an index are altered, its historical performance, which may have been driven by the previous methodology, becomes less relevant. Investors can no longer confidently extrapolate past outperformance or underperformance to future expectations. This situation bears a striking resemblance to the "fund manager risk" associated with actively managed funds, where investors rely on the manager’s skill and strategy, which can also evolve.
While factor funds are often lauded for their rule-based approach, the potential for the rulebook itself to change introduces a layer of uncertainty that erodes this perceived advantage.
H2: Market Capitalization Indices: A Bastion of Stability?
In contrast to factor indices, market capitalization-weighted indices offer a significantly higher degree of stability and predictability concerning their core methodology. The definition of "large-cap" or "large capitalization" is relatively immutable. While the constituents of such indices may change as companies grow or shrink, the fundamental criteria for inclusion remain consistent. This inherent stability makes them a preferred choice for the core of an equity portfolio, offering a more reliable long-term investment vehicle.
H2: Navigating the Landscape: Should You Avoid Factor Funds?
The decision of whether to invest in factor funds ultimately rests with the individual investor. When opting for a factor index fund, investors are placing their trust in a rulebook maintained and potentially revised by a third party. This introduces an element of dependence and potential unpredictability.
H3: Strategic Allocation and Due Diligence
Market capitalization indices, with their objective and rarely redefined rules, largely circumvent this particular risk. They serve as a robust foundation for an equity portfolio. Factor index funds, on the other hand, might be more suitable as part of a "satellite" equity portfolio, akin to actively managed funds, where a degree of active selection and strategic allocation is inherent.
The decision to utilize factor products, the specific products chosen, and the allocation size should be guided by an investor’s risk profile and conviction in a particular factor strategy. It is crucial to recognize that factor strategies can experience prolonged periods of underperformance, testing an investor’s patience. Therefore, the sizing of allocations to factor products must be carefully considered, especially when the very definition of the strategy can evolve.
H3: The Imperative of Ongoing Monitoring
As highlighted by the Nifty 50 Value 20 example, investors must remain vigilant and regularly review the methodology of any factor index fund they invest in. A drastic change in index methodology necessitates a reassessment of the investment decision.
Conclusion
The case of the Nifty 50 Value 20 index serves as a potent reminder of the inherent risks associated with factor-based index investing. The ability of index providers to revise their methodologies, while often justifiable from their perspective, can fundamentally alter the investment characteristics of a fund without direct investor notification. This opacity can lead to unintended portfolio shifts and an erosion of trust in past performance data.
For investors seeking stability and predictability, traditional market capitalization-weighted indices offer a more robust foundation for their core equity holdings. Factor funds, while potentially offering diversification and exposure to specific investment styles, should be approached with caution, a thorough understanding of their underlying methodologies, and a commitment to ongoing monitoring. The principle of "do your own homework" is paramount, ensuring that investment decisions are based on a clear understanding of the evolving landscape and one’s own risk tolerance and financial objectives.
Disclaimer: This article is for educational purposes only and does not constitute investment advice. Investors should conduct their own due diligence and consult with a qualified financial advisor before making any investment decisions. Registration with SEBI, membership of BASL, and NISM certification do not guarantee investment performance or returns. Investment in the securities market is subject to market risks.