
Mumbai, India – A prevailing sentiment among Indian equity investors is that "smaller is better." This notion, often fueled by anecdotal evidence and headline-grabbing returns from mid and small-cap segments, suggests that venturing into smaller companies invariably leads to greater wealth creation. However, a comprehensive analysis of over two decades of market data reveals a more nuanced reality, one where the allure of size reduction comes with a significant caveat: increased volatility and the potential for a rougher investment ride.
This article delves deep into the performance of various market capitalization-based indices in India, scrutinizing their returns, risks, and consistency over the past 21 years. By dissecting calendar year returns, Compound Annual Growth Rate (CAGR), rolling returns, and key risk metrics, we aim to demystify the perceived advantage of smaller-cap investing and provide investors with a data-driven perspective to inform their decisions.
The Landscape of Indian Equity Indices: A Cap-Based Spectrum
Before delving into the performance data, it’s crucial to understand the distinctions between the indices that represent different segments of the Indian equity market. These indices are primarily differentiated by the market capitalization of the companies they track, offering investors a spectrum from the largest, most established corporations to the smallest, emerging players.
- Nifty 50: This flagship index represents the top 50 companies by market capitalization listed on the National Stock Exchange (NSE). It is often considered a proxy for the overall health and performance of the Indian large-cap equity market.
- Nifty 100: Expanding on the Nifty 50, this index includes the top 100 companies by market capitalization, offering a broader representation of the large-cap segment.
- Nifty 500: This is a more comprehensive index, tracking the top 500 companies. It provides a broad market view, encompassing large, mid, and some small-cap stocks.
- Nifty Large & Midcap 250: This index combines the top 100 large-cap companies with the next 150 mid-cap companies, aiming to capture the growth potential of both segments.
- Nifty Next 50: This index tracks companies ranked from 51st to 100th by market capitalization, essentially the next wave of large-cap companies after the Nifty 50 constituents.
- Nifty Midcap 150: This index focuses on companies ranked from 101st to 250th by market capitalization, representing the core mid-cap segment.
- Nifty Smallcap 250: This index covers companies ranked from 251st to 500th by market capitalization, delving into the small-cap universe.
- Nifty Microcap 250: This index extends further down the market capitalization ladder, tracking companies ranked from 501st to 750th, representing the smallest listed entities in this analysis.
The fundamental premise of investing in smaller-cap stocks is the expectation of higher returns to compensate for the inherent increase in risk. Smaller companies often have greater growth potential but also face higher operational challenges, liquidity constraints, and are more susceptible to market downturns. This analysis aims to empirically validate whether this expectation translates into superior risk-adjusted returns over the long term.
Calendar Year Returns: A Tale of Two Extremes
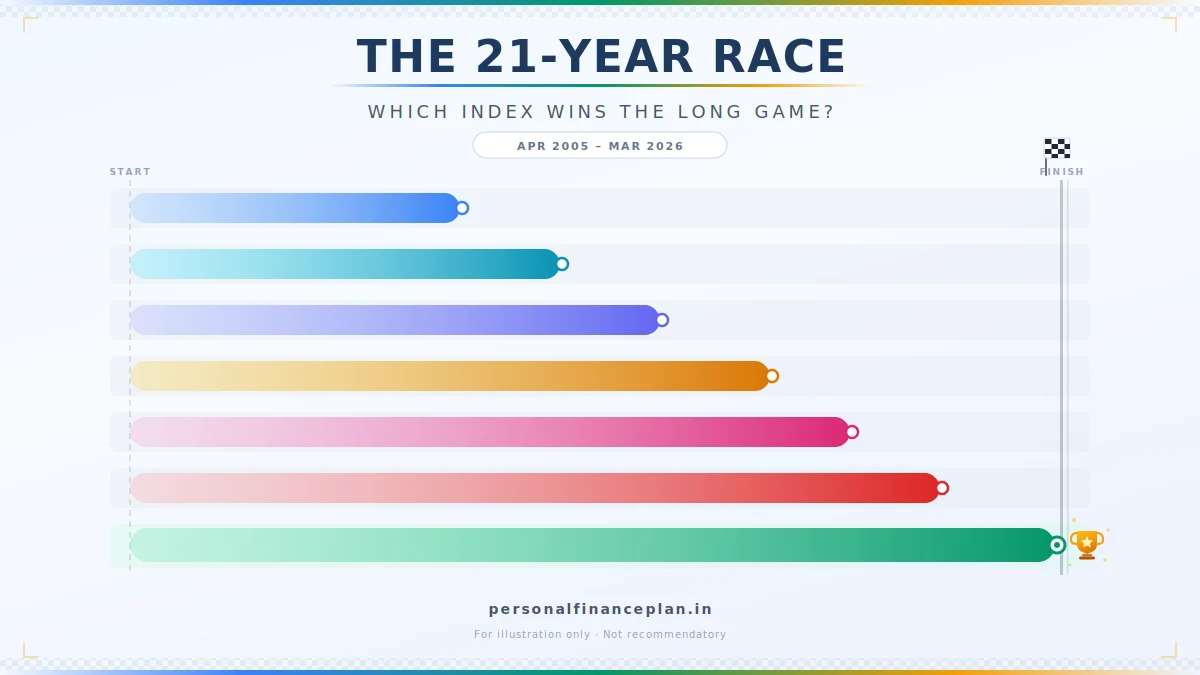
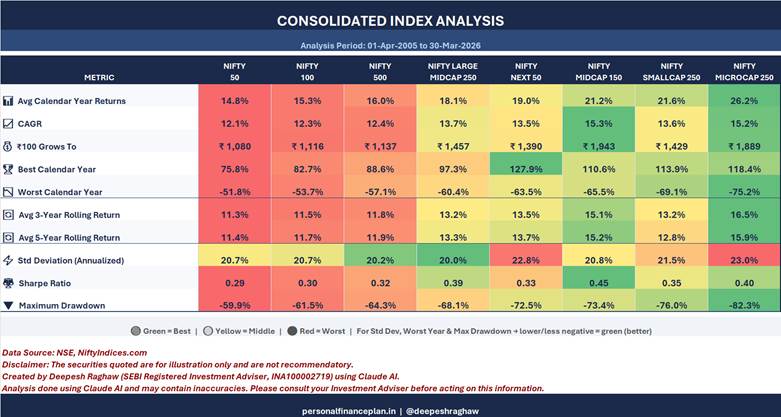
An initial glance at calendar year returns across these indices over the 21-year period (April 1, 2005, to March 31, 2026) might reinforce the "smaller is better" narrative. On average, smaller indices have indeed posted higher returns. For instance, the Nifty Midcap 150 averaged 21.2% annually, while the Nifty Microcap 250 delivered an impressive 26.2%. In stark contrast, the Nifty 50 averaged 14.8%.
However, this surface-level observation masks the significant volatility associated with smaller caps. The same indices that soar in good times can plummet dramatically in adverse market conditions. The financial crisis of 2008 serves as a stark illustration. While the Nifty 50 experienced a decline of 51.8%, the Nifty Smallcap 250 fell by a staggering 69.1%, and the Nifty Microcap 250 plunged by 75.2%. Similarly, in 2018, while the Nifty 50 eked out a modest 3.2% gain, the Nifty Microcap 250 registered a significant loss of 27.7%. The year 2011 saw the Nifty 50 fall 24.6%, while the Nifty Microcap 250 suffered a steeper decline of 41.6%.
Conversely, during bull markets, the performance of smaller indices can be spectacular. The Nifty Next 50, for example, surged by 127.9% in 2009, and the Nifty Microcap 250 posted a remarkable 118.4% gain in the same year. In 2014, the Nifty Microcap 250 climbed by over 100%, and in 2007, the Nifty Smallcap 250 witnessed an increase of 94.9%.
This pattern highlights a critical distinction: while smaller caps offer the potential for exponential gains during favorable market phases, they also expose investors to significantly amplified losses during downturns. The question for investors then becomes not just about potential returns, but about their capacity to withstand such sharp drawdowns.
Consolidated Performance: Where the Real Story Unfolds
A deeper dive into consolidated performance metrics provides a more realistic picture, moving beyond simple averages to account for the compounding effect and the impact of volatility.
Average Returns vs. CAGR: The Volatility Drag
The discrepancy between average calendar year returns and Compound Annual Growth Rate (CAGR) is a crucial indicator of volatility. For the Nifty Microcap 250, the average annual return of 26.2% dwindles to a CAGR of just 15.2% over the 21-year period. This substantial gap of approximately 11 percentage points is attributed to "volatility drag," a phenomenon where the compounding effect of negative returns in volatile periods significantly erodes overall wealth creation, even if average positive returns appear high.

In contrast, the Nifty 50, with its lower volatility, exhibits a smaller gap between its average return of 14.8% and its CAGR of 12.1%, a difference of only 2.7 percentage points. This underscores that while smaller indices may promise higher nominal returns on paper, the actual wealth generated through consistent compounding is often more pronounced in less volatile, larger-cap segments.
The Rs 100 Growth Experiment: Wealth Creation in Action
To illustrate the impact of volatility drag, consider an investment of Rs 100 in April 2005, tracked until March 2026. The results paint a surprising picture:
- Nifty 50: Rs 100 grew to approximately Rs 1,053.
- Nifty 100: Rs 100 grew to approximately Rs 1,195.
- Nifty 500: Rs 100 grew to approximately Rs 1,564.
- Nifty Large & Midcap 250: Rs 100 grew to approximately Rs 1,898.
- Nifty Next 50: Rs 100 grew to approximately Rs 2,280.
- Nifty Midcap 150: Rs 100 grew to approximately Rs 2,779.
- Nifty Smallcap 250: Rs 100 grew to approximately Rs 2,730.
- Nifty Microcap 250: Rs 100 grew to approximately Rs 2,216.
The data reveals that the Nifty Midcap 150, despite not having the highest average calendar year returns, ultimately created more wealth than the Nifty Microcap 250. This outcome is a direct consequence of the volatility drag experienced by the microcap index. The higher average returns were more than offset by the severe impact of drawdowns on the compounding growth. Similarly, the Nifty Smallcap 250, while performing respectably, did not significantly outperform the Nifty Midcap 150, suggesting that the incremental risk taken did not always translate into superior wealth creation.
Risk: The Uncomfortable Truths Unveiled
The difference in risk profiles between these indices is stark and provides crucial context to their return performances.
- Standard Deviation: This metric measures the dispersion of returns around the average, indicating volatility. The Nifty 50 exhibits a standard deviation of 20.7%. In contrast, the Nifty Microcap 250 shows a significantly higher standard deviation of 23%, indicating greater price fluctuations.
- Maximum Drawdown: This represents the largest peak-to-trough decline in an investment’s value. The Nifty 50 experienced a maximum drawdown of -59.9%. For the Nifty Microcap 250, this figure is a terrifying -82.3%. A drawdown of this magnitude means an initial investment of Rs 1 lac would shrink to a mere Rs 17,700. To simply recover the initial investment from such a low point would require an astronomical gain of 449%. This illustrates the immense psychological and financial pressure investors face during severe market corrections in small and micro-cap segments.
- Sharpe Ratio: This is a key measure of risk-adjusted returns, indicating how much excess return an investment generates for each unit of risk taken. A higher Sharpe ratio is desirable. In this analysis, the Nifty Midcap 150 emerged with the highest Sharpe ratio at 0.45, suggesting it offered the best risk-adjusted returns. The Nifty 50 had the lowest at 0.29. The Nifty Smallcap 250 recorded a Sharpe ratio of 0.35, while the Nifty Microcap 250, despite its higher average returns, had a Sharpe ratio of 0.40, falling short of the Nifty Midcap 150. This indicates that while microcaps can generate high returns, they do so with a level of risk that diminishes their risk-adjusted attractiveness compared to mid-cap indices.
Rolling Returns: The Test of Consistency
Rolling returns provide a more realistic view of investment performance by examining returns over various overlapping periods, offering insights into consistency rather than just point-to-point performance.
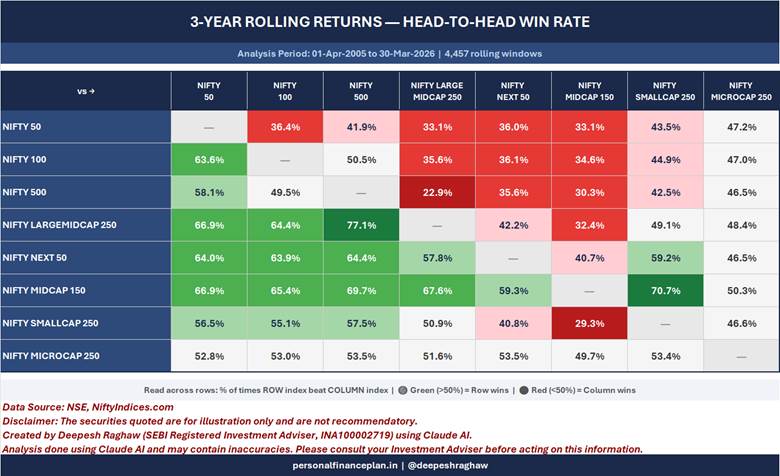
The data on 5-year rolling returns reveals a surprising trend: the Nifty Smallcap 250 underperformed the Nifty Midcap 150 over 80% of the time. Similarly, in 3-year rolling returns, the small-cap index lagged behind the mid-cap index approximately 70% of the time. This contradicts the intuition that smaller stocks, with their inherent growth potential, should consistently outperform their larger mid-cap counterparts over longer periods.
Furthermore, over any random 5-year period, the Nifty Smallcap 250 outperformed the Nifty 50 only about 48.9% of the time. This means that an investor choosing to invest in the Nifty Smallcap 250 for a random 5-year duration had a nearly equal chance of seeing the Nifty 50 deliver better returns. This highlights the unpredictable nature of small-cap performance and the significant risk of experiencing underperformance even over extended holding periods.
The analysis suggests that while small and micro-cap indices may show higher average returns on a point-to-point basis over 21 years, their inconsistent performance, amplified volatility, and the resulting volatility drag significantly diminish their long-term wealth creation potential compared to mid-cap indices, and in many instances, even large-cap indices over rolling periods.
Implications for Investors: Navigating the Market Cap Maze
This comprehensive analysis yields several critical implications for investors considering a strategy focused on smaller-cap equities in India:
- Re-evaluate the "Smaller is Better" Mantra: The data strongly suggests that the simplistic belief that smaller market capitalization automatically translates to superior returns is flawed. While potential for high returns exists, it is intrinsically linked to significantly higher risks.
- Understand Volatility Drag: Investors must be acutely aware of volatility drag. High average returns can be illusory if the compounding effect is consistently eroded by sharp drawdowns. CAGR and rolling returns are more reliable indicators of actual wealth creation.
- Risk Tolerance is Paramount: The significantly higher maximum drawdowns in small and micro-cap segments demand an exceptionally high level of risk tolerance. Investors must be psychologically and financially prepared to withstand substantial paper losses, which can sometimes take years to recover.
- Mid-Caps as a Sweet Spot: The Nifty Midcap 150 appears to offer a compelling balance, delivering strong returns with better risk-adjusted performance (Sharpe ratio) and more consistent outcomes over rolling periods compared to small and micro-caps. This segment might represent a more optimal risk-reward profile for many investors seeking growth beyond large caps.
- The Role of Diversification: Diversification across market caps, sectors, and asset classes remains a cornerstone of prudent investment strategy. Relying solely on one segment, especially a volatile one, can be detrimental.
- Long-Term Perspective is Key, but Not a Guarantee: While a long-term investment horizon is always recommended, the analysis shows that even over 5-year rolling periods, the advantage of small caps is not guaranteed. Patience is required, but it must be coupled with a robust understanding of the underlying risks.
- Active vs. Passive: This analysis focuses on index performance. Active fund managers in the mid and small-cap space may aim to mitigate some of the risks through stock selection, but their ability to consistently outperform the index while managing volatility is also a subject of separate scrutiny.
Conclusion: A Measured Approach to Growth
The allure of exponential returns from India’s smaller listed companies is undeniable, but the data from the past two decades offers a cautionary tale. While the average returns might appear enticing, the reality of investing in these segments is characterized by significantly higher volatility, deeper drawdowns, and a less consistent path to wealth creation.
For the discerning investor, the Nifty Midcap 150 emerges as a potentially more robust segment, offering a compelling blend of growth and risk management. The Nifty 50 and Nifty 100 continue to provide stability and steady compounding. The micro and small-cap spaces, while holding the promise of outsized gains, demand a profound understanding of risk and an unwavering fortitude to navigate the inevitable market storms. Ultimately, a well-diversified portfolio, tailored to individual risk appetite and financial goals, remains the most prudent path to sustainable wealth creation in the dynamic Indian equity market.
Disclaimer: This article is intended for educational purposes only and does not constitute investment advice. Market investments are subject to market risks. Investors are advised to conduct their own research and consult with a qualified financial advisor before making any investment decisions. The performance data presented is based on historical information and is not indicative of future results. The use of AI for analysis is acknowledged, and while checks have been performed, potential inaccuracies cannot be entirely ruled out. Investors should exercise due diligence.